



Login
Get Instant Pricing On 23,000+ Aircraft

>

Some aircraft types have earned reputations as dangerous planes through decades of commercial jet airplane accidents. But which ones truly hold the worst safety record, and what do the numbers actually say?
The answer depends on how you measure it. If you rank by total fatalities, the Boeing 737 family leads with roughly 4,800 deaths across all variants — but that figure reflects the fact that it is the most produced and most flown passenger jet in history, not that it is inherently the most dangerous per flight.
The real worst safety record aircraft emerge when you normalize by departures. Among Western jet airliners with reliable data, the Fokker F28 Fellowship holds one of the highest hull loss rates at 4.62 per million departures and 2.31 fatal hull losses per million departures. The McDonnell Douglas MD-11 follows at 3.41 hull losses per million departures, and the Airbus A310 records a fatal hull loss rate of 1.89 per million departures.
First-generation types like the de Havilland Comet were even worse statistically, but their tiny fleets and experimental-era context make direct comparison difficult.
The Boeing 737 MAX, after its well-publicized grounding, now shows a hull loss rate of about 0.27 per million departures — in line with other modern jet airliners in active service.
For travelers weighing commercial aviation risk or exploring private charter, these statistics matter. Platforms like Jettly approach safety differently by connecting passengers with vetted operators flying a wide selection of private charter aircraft with modern, well-maintained fleets rather than relying on a single airline service or aircraft type.
A hull loss occurs when an aircraft is destroyed or damaged beyond economical repair. A fatal hull loss is the subset where occupant deaths result, and this rate is often expressed per million departures, or per one million flights. These are the standard metrics used to evaluate aircraft safety records rather than just raw numbers of crashes.
Why per million departures? Most major accidents happen during takeoff or landing - not during cruise. Counting departures (flight cycles) captures exposure to those critical phases far better than flight hours or distance flown.
Here is a simple example: if an aircraft type accumulates 10 million departures and suffers 5 hull losses, its rate is 0.50 per million departures. A different aircraft with only 500,000 departures and 5 hull losses would have a rate of 10.0 per million - twenty times worse, despite the same absolute number.
This is why raw totals of fatal accidents can be misleading. The Boeing 737's high death count reflects hundreds of millions of flights over six decades. Rarer types may look safer in absolute terms but far worse when measured per departure.
Data for some military aircraft, Soviet-era types, and regional airplanes may be incomplete, so most authoritative rankings - including the Boeing Statistical Summary - rely primarily on Western commercial aircraft where departure counts are well documented.
When people search for the deadliest aircraft, they usually mean total onboard deaths across a type's entire career. By that measure, three Boeing models dominate:
|
Aircraft |
Approximate Total Fatalities |
Primary Reason for High Count |
|---|---|---|
|
Boeing 737 (all variants) |
~4,800 |
Most produced and flown commercial aircraft |
|
Boeing 727 |
~4,200 |
Workhorse of the 1960s–1990s |
|
Boeing 747 |
~3,700 |
High capacity; catastrophic events like Tenerife 1977 |
The Boeing 727 accumulated most fatalities during its early decades when airline safety standards, navigation aids, and crew training were far less advanced. The Boeing 747's toll includes one crash - the Tenerife runway collision involving two airframes - that killed 583 people, the deadliest accident in aviation history.
Some high-fatality events were not caused by any design flaw. Malaysia Airlines Flight 17, shot down by a missile, and several hijacking-related disasters inflate totals for otherwise safe types. Air France's A330 crash in 2009 and Japan Airlines' catastrophic 1985 accident involved factors ranging from pilot error to improper maintenance rather than inherent aircraft deficiency.
These numbers tell you about fleet scale, not per-flight risk. The sections below pivot to normalized metrics that better identify which aircraft types truly have the worst safety record.
When hull loss accidents are measured per million departures, a different picture emerges. Here are the worst-performing Western commercial aircraft types with reasonably solid data, drawn from Boeing's data in its Statistical Summary:
|
Aircraft Type |
Hull Losses / Million Departures |
Fatal Hull Losses / Million Departures |
|---|---|---|
|
Fokker F28 Fellowship |
4.62 |
2.31 |
|
McDonnell Douglas MD-11 |
3.41 |
1.86 |
|
Airbus A310 |
2.52 |
1.89 |
|
Boeing 737-100/200 |
1.76 |
0.87 |
|
BAe 146 / Avro RJ |
1.49 |
0.66 |
|
Boeing 727 |
1.25 |
0.72 |
The Fokker F28 stands out as the worst safety record holder among Western passenger jets. Its high hull loss rate was influenced by weather sensitivity and design issues, compounded by frequent operations into marginal airfields across Central America, Africa, and Southeast Asia. The MD-11's 3.41 hull losses per million departures reflect persistent landing and handling challenges. The A310's fatal rate of 1.89 per million departures makes it the worst among wide body aircraft still recently in commercial service.
The Boeing 737-100/200 recorded 1.76 hull losses per million departures and 0.87 hull losses with fatalities per million departures, but the vast majority of these incidents occurred before modern safety systems like GPWS and TCAS existed. The accident rate dropped sharply with each successive 737 generation.
McDonnell Douglas types appear frequently in any discussion of the most dangerous planes and worst airlines safety records. The reasons vary from structural flaws to aerodynamic compromises.
DC-10 and the cargo door problem. Structural flaws in the McDonnell Douglas DC-10's cargo door contributed to catastrophic accidents, most notably Turkish Airlines Flight 981 in 1974, which killed 346 people near Paris when an improperly latched cargo door blew out mid air and severed control cables. The McDonnell Douglas DC-10 has a hull loss with fatalities rate of 1.28 per million departures. American Airlines Flight 191 in 1979 - the deadliest single fatal crash on U.S. soil - involved an engine failure during takeoff at Chicago when the engine separated. Investigation revealed that maintenance procedures, not just aircraft design, directly led to the failure.
MD-11 handling challenges. The MD-11 evolved from the DC-10 with smaller tailplanes and an aft center of gravity to improve fuel efficiency. These changes made landing more demanding. Several hard-landing rollover accidents, including cargo incidents, contributed to its 3.41 hull losses per million departures. Swissair Flight 111 (1998) killed all 229 aboard after an in-flight fire, though that accident stemmed from flammable insulation materials rather than flight control issues. Automation failures can complicate pilot responses during in-flight emergencies, leading to accidents - a pattern visible across multiple MD-11 incidents.
DC-9 family and its descendants. The DC-9 recorded about 0.77 fatal hull losses per million departures, with many later accidents tied to aging airframes, pilot error, and variable maintenance standards. Derivatives like the MD-80, MD-90, and Boeing 717 show notably better records, underscoring how design refinements and stricter oversight improved outcomes across different aircraft generations.
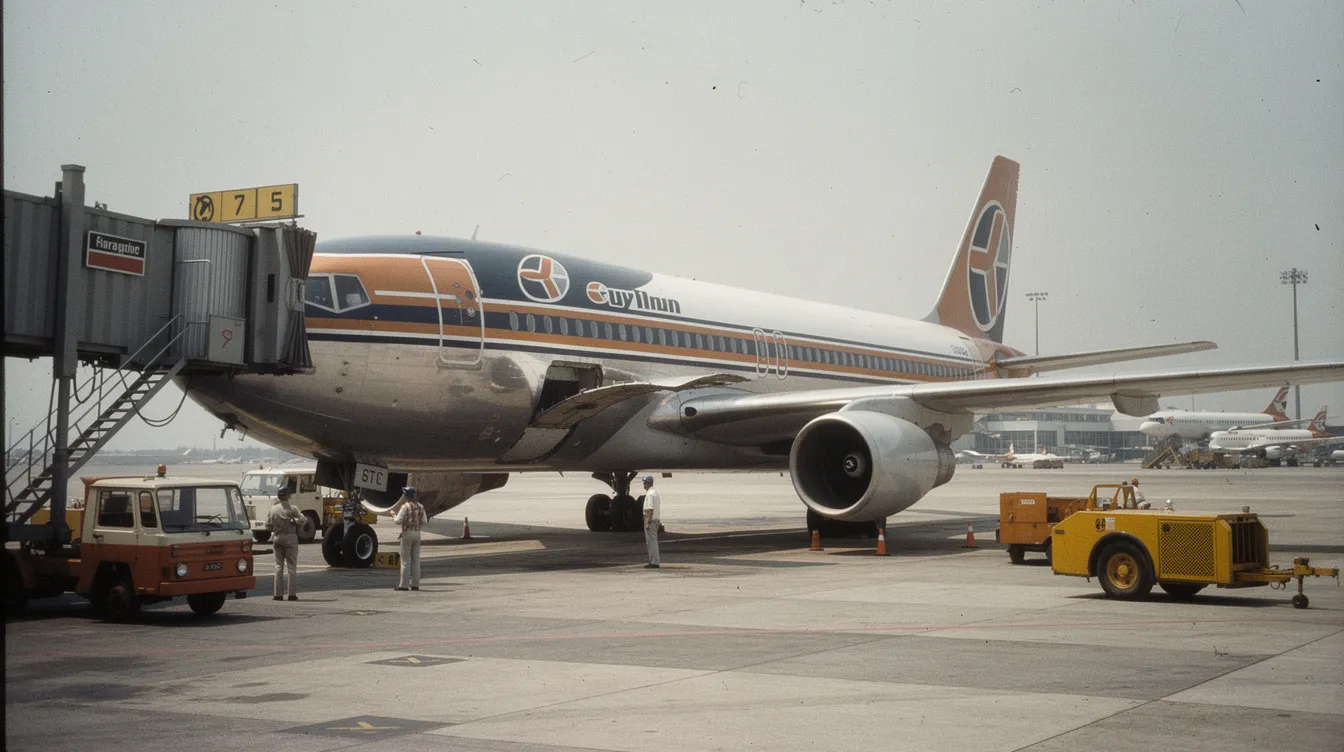
The de Havilland Comet suffered high hull-loss rates due to metal fatigue and design flaws - specifically, stress concentrations around its square windows that caused explosive decompression at cruise altitude. Of 22 Comet 1/1A airplanes built, five were destroyed in hull loss accidents, four with total casualties. Many early jet-age airliners suffered high loss rates due to unproven technologies and inadequate instrumentation.
The Comet's hull loss ratio arguably makes it the worst safety record aircraft among early commercial jets, though its fleet was tiny and operated in an era when almost nobody fully understood pressurization fatigue.
The Boeing 707 recorded roughly 6.0 hull losses per million departures during the 1960s as airlines based across the world pushed long-range jet operations into regions with less advanced infrastructure. The Caravelle and Convair 880/990 posted similarly high rates.
Early widebodies like the DC-10 and Lockheed L-1011 TriStar faced teething problems but also drove rapid advances in structural testing, systems redundancy, and certification standards. The lessons from Comet disasters - where metal fatigue was first understood in pressurized airplanes - directly shaped modern pressurization and structural testing requirements for every commercial aircraft that followed.
These first-generation jets operated under very different regulatory regimes. Comparing a Comet 1's accident rate with a modern Airbus A350 is like comparing a Model T's crash record with a modern car. The regulatory framework, testing standards, and operational knowledge were worlds apart.
Some of the most dangerous aircraft statistically attract less public attention because they carry fewer million passengers and fly less prominent routes.
The Fokker F28 Fellowship was designed for short-haul regional flying - exactly the kind of operations involving difficult runways, challenging weather, and less-developed airport infrastructure. Environmental and operational challenges can significantly impact aircraft accident rates, and the F28's record reflects this. With 4.62 hull losses per million departures, it stands as a great aircraft in concept but a cautionary example in practice.
The BAe 146 / Avro RJ, with about 1.49 hull losses per million flights, operated into short, mountainous, or poorly equipped airports. Its accident rate owes more to operational context than to systemic design failure - it was powered by four Rolls Royce-derived ALF502 engines and had solid basic engineering.
Outside airline service, types like the Mitsubishi MU-2 and Raytheon Premier 1 earned reputations as demanding airplanes among owner-pilots. These aircraft operate outside major airlines oversight, with varying pilot training and maintenance standards, complicating comparisons with mainline jet airliners.
Jettly's curated charter operators typically avoid high-risk or unsupported types, favoring modern or well-maintained fleets subjected to strict regulatory oversight.
Soviet and Russian commercial aircraft like the Ilyushin Il-62, Tupolev Tu-154, and Ilyushin Il-76 frequently appear in discussions of the deadliest aircraft.
The Il-62 suffered 22 hull losses out of 287 built, with approximately 1,141 total fatalities. The Tu-154 recorded roughly 29 fatal accidents across an estimated 13 million flights, yielding about 2.2 fatal accidents per million flights - worse than the Boeing 737 by a significant margin. However, Soviet-era departure data is often incomplete or underreported.
The Tu-144 supersonic transport saw only two major accidents but completed very few flights in airline service. Aeroflot itself was reportedly reluctant to operate it due to reliability concerns - the plane was permanently retired after minimal commercial service.
Military aircraft operate in fundamentally different profiles - low-level flight, combat zones, aerial refueling - making their accident statistics non-comparable to commercial aviation data. The Boeing Statistical Summary and similar sources generally exclude Soviet and military aircraft from per million departure rankings for this reason.
For travelers, the practical takeaway is simple: if a commercial route uses older or obscure types under lightly regulated regimes, that should be treated as a safety red flag regardless of the plane's basic design capabilities, much as understanding Part 135 charter companies and their regulations helps private fliers distinguish between compliant and high-risk operators.
The Boeing 737 is the most produced commercial aircraft in history, with over 8,600 deliveries across all generations and hundreds of millions of departures.
Each generation shows dramatically different safety performance:
|
Generation |
Hull Losses / Million Departures |
Fatal Hull Losses / Million Departures |
|---|---|---|
|
737-100/200 |
1.76 |
0.87 |
|
737 Classic (-300/-400/-500) |
0.88 |
~0.42 |
|
737 NG (-600/-700/-800/-900) |
0.16 |
0.08 |
|
737 MAX |
0.27 |
0.27 |
The 737-100 and 737-200 have 1.76 hull losses per million departures, with most incidents predating modern safety technologies. The 737 NG's 0.16 rate makes it among the safest commercial aircraft ever built.
The Boeing 737 MAX faced a global grounding due to design flaws leading to two fatal crashes - Lion Air Flight 610 (2018) and Ethiopian Airlines Flight 302 (2019). Both were linked to the MCAS flight control system, resulting in a 20-month grounding and extensive software, training, and documentation changes. The Boeing 737 MAX now has a hull loss rate of 0.27 per million departures based on several million flights since its return to service. Public perception still lags behind the statistics on airline safety, but the data shows it performing in line with other modern types.
For context, United Airlines and American Airlines - two of the world's largest carriers - both operate large 737 MAX fleets today without incident since the fixes were implemented.
Airbus's early widebodies appear frequently in rankings of dangerous aircraft when measured by hull losses per million departures.
The early A300 B2/B4 variants recorded around 2.69 hull losses per million departures, though many incidents involved non-fatal runway excursions or cargo-only operations. The Airbus A300 has a hull loss with fatalities rate of 0.63 per million passengers.
The Airbus A310's fatal hull loss rate of 1.89 per million departures is among the highest for any Western wide body aircraft. Notable accidents include:
TAROM Flight 371 (1995, Romania) - autopilot transition failure
Kenya Airways Flight 431 (2000, off Côte d'Ivoire) - spatial disorientation after takeoff
Yemenia Flight 626 (2009, Comoros) - one crash that killed 152 of 153 aboard
Most A300/A310 passenger fleets are now permanently retired, with remaining aircraft largely serving as freighters. Safety records of older aircraft types are often skewed by operational environments and maintenance practices rather than fundamental design shortcomings. Later Airbus flagships built a perfect safety record in commercial service for years.
By comparison, modern long-haul types like the Airbus A350 and Boeing 777 entered service with a perfect record or near-perfect record before any major fatal event, and both have extremely low hull loss rates. Air France 358, an A340 overrun at Toronto in 2005, illustrates that a hull loss does not always mean passenger fatalities; all 309 people aboard survived.
Qatar Airways, often ranked among the safest passenger planes operators, flies exclusively modern Airbus and Boeing types - a stark contrast to the A310-era fleet profiles.
Looking only at lifetime hull loss rates penalizes older aircraft that spent decades flying when industry-wide accident rates were far higher. The Boeing Statistical Summary shows that industry hull loss rates dropped by more than 50% between the late 20th century and the 2020s.
Modern clean-sheet designs cluster around or below 0.4 hull losses per million departures. Airbus reports that its current-generation jets average roughly 0.10 hull losses per million departures - a safest commercial aircraft benchmark that would have been unimaginable in the 1960s.
Airline safety today depends more on operator quality, regulation, and region than on any mainstream aircraft type. Hull loss rates in North America and Western Europe are dramatically lower than in some parts of Africa or Central America. Regulatory interventions like FAA airworthiness directives have improved aircraft safety across all types and operators.
An old but well-maintained fleet under strong oversight can be safer than a new aircraft operated under lax regulation. This principle applies equally to major airlines, Yeti Airlines-style regional carriers, and the worst airlines by safety rating.
For private aviation, the same logic holds: operator safety culture and regulatory compliance usually outweigh the specific model of business jet being flown, which is why comparisons of the best private jet charter companies and their safety practices focus so heavily on oversight and operator standards. Understanding this helps travelers make informed decisions about their next flight.
Jettly operates as a digital private jet charter platform, connecting travelers with vetted operators across a global fleet rather than flying a single in-house fleet. This model differs fundamentally from scheduled airline service.
Private jet categories - light jets, midsize, heavy jets, and turboprops - differ from large commercial aircraft in mission profile, cycle counts, and maintenance patterns. Choosing between manufacturers like Gulfstream, Bombardier, or Textron also shapes performance and safety characteristics, as outlined in guides to the best private plane manufacturers for different needs. A single fatality on a light jet flight registers differently in statistics than one accident involving a wide-body carrying 300 passengers.
Jettly focuses on operators that comply with national regulators (FAA Part 135 in the U.S., EASA approvals in Europe) and, where applicable, independent third-party safety audits. Its tiered private jet membership programs build these safety and oversight requirements into how flights are sourced and priced. The platform emphasizes aircraft with strong safety records and reliable support networks — avoiding aging, poorly supported, or high-risk types with questionable hull loss histories.
Practical examples include an executive chartering a light jet for a short route that avoids crowded hubs located with an airport locator tool for private flights, a family using a midsize jet to bypass multiple commercial connections, and urgent medical or business trips where schedule control reduces operational risks. For travelers who want to understand whether private jets are safe, the answer lies in operator selection — exactly the problem Jettly's marketplace is designed to solve.
Understanding the worst safety record aircraft in airline history helps illustrate how far flying has come — and why choosing a properly vetted private operator can further reduce risk and uncertainty, especially when you know how to get a seat on a private jet affordably without compromising on operator quality.
A hull loss occurs when an aircraft is damaged beyond economical repair or destroyed. It is a key metric used to assess the safety record of aircraft types.
The Fokker F28 has the highest hull loss rate per million departures among Western jet airliners, influenced by design issues, weather sensitivity, and challenging operational environments.
After its grounding and fixes following two fatal accidents, the Boeing 737 MAX now shows a hull loss rate in line with other modern jets, indicating improved safety.
Older aircraft often show higher historical accident rates, but these reflect the safety standards and technologies of their operating eras rather than inherent design flaws.
Jettly partners with vetted operators who comply with stringent regulatory standards and safety audits, focusing on well-maintained fleets and transparent oversight.
Operator quality, regulatory oversight, maintenance standards, and the operational environment have a greater influence on safety than the aircraft model alone.
The worst safety record by rate belongs to types like the Fokker F28, de Havilland Comet, MD-11, and A310. The deadliest aircraft by total fatalities are the Boeing 737, 727, and 747 — primarily because they were the world's most-flown airplanes, not because they were the most dangerous planes per departure.
For modern travelers, airline safety is generally high. The real differences lie in operator standards, route environments, and regulatory oversight rather than whether a flight is on a Boeing or Airbus model. No single fatality on a well-regulated airline today reflects the systemic risks that plagued commercial aviation in the 1960s through the 1980s. An American Airlines flight today operates in a fundamentally different safety environment than one in 1979.
Private jet charter through Jettly allows travelers to factor in both aircraft type and operator quality. By combining schedule control with carefully vetted safety practices, Jettly's platform helps passengers avoid the kinds of risk factors — aging fleets, weak oversight, unsupported types — that historically produced the worst safety record aircraft in aviation.
Ready to experience private travel on your terms? You can compare traditional fractional models with a flexible NetJets alternative in Jettly and then explore flight options or request a quote at https://www.jettly.com.
Share this post:
Jeff Ryan Serevilla
Oct 22, 2026
|
5
min read
Discover tips and trends in the industry.
5
min read
Jet Number: How Private Jet Tail Numbers, Registration, and Tracking Really Work
Every private jet has a unique jet number, also known as a tail number, which serves as its identification in the aviation world. This alphanumeric code is crucial for air traffic control, legal records, and flight tracking, ensuring safety and compliance. Understanding jet numbers can enhance the private jet booking experience, providing travelers with essential information about the aircraft.
Read More
5
min read
KGRK: Robert Gray Army Airfield & Fort Hood Regional Travel Guide
Robert Gray Army Airfield (KGRK) serves as a vital joint-use airfield for Fort Hood and the Killeen area, facilitating both military and commercial aviation. With a 9,997-foot runway and 24-hour operations, it supports a range of aircraft and offers direct access to Central Texas. This travel guide provides essential information for military personnel, families, and business travelers using KGRK.
Read MoreStay updated with our latest insights and tips to elevate your journey with us.
MEMBERSHIPS AND ASSOCIATIONS



Disclaimer: Jettly operates as a charter broker, offering access to a global digital jet charter marketplace. Jettly is not a direct air carrier and does not own or operate aircraft. All advertised flights are conducted by third-party air carriers that are fully licensed and hold the appropriate Part 135 or Part 121 certifications issued by the Federal Aviation Administration (FAA) or equivalent regulatory authorities under U.S. or foreign law. Jettly complies fully with the U.S. Department of Transportation's Part 295 and Part 298 Charter Broker regulations. Jettly does not carry additional liability insurance. Passengers are covered by aircraft operator insurance. TICO: 50023770


