



Login
Get Instant Pricing On 23,000+ Aircraft

>

As Labor Day approaches, millions of Americans prepare to travel, eager to make the most of the long weekend. However, delays, cancellations, and other travel hiccups can turn a much-anticipated trip into a stressful ordeal. To help you make the most of the busiest travel days of the year, we've analyzed historical flight data to reveal which airlines and airports are the best and worst for Labor Day travel.
In this article, you'll find data-driven insights into which airlines and airports are most likely to experience delays, cancellations, and on-time departures. Whether you're planning a trip or just curious, this comprehensive guide will help you make more informed travel decisions this Labor Day weekend.

Select an Image
VIEW COMPLETE DATA HERE: https://public.flourish.studio/visualisation/19040700/

Select an Image
VIEW COMPLETE DATA HERE: https://public.flourish.studio/visualisation/19040800/
For this study, we leveraged the Bureau of Transportation Statistics to analyze departing flights on Labor Day. We looked at the average percentage of on-time, delayed, and canceled flights by major US airlines and airports from 2019 to 2023 overall.
Jettly's platform connects passengers to a broad fleet of private jets. With a focus on flexibility and personalized service, we provide cost-effective solutions for every travel need.
This data is provided for noncommercial use only. If you plan to share it, please provide a link to the source.
Share this post:
Justin Crabbe
May 7, 2025
|
5 minutes
min read
Discover tips and trends in the industry.

5
min read
How Much Does a 25 Hour NetJets Card Cost in 2026?
In 2026, a 25-hour NetJets card for a light jet like the Phenom 300 starts at approximately $215,000, with total costs reaching between $247,000 and $262,000 after additional fees. This guide provides a comprehensive breakdown of costs, comparisons with fractional ownership, and insights into whether prepaying for flight hours is the best option for travelers. Understanding these details helps buyers make informed decisions about private aviation solutions.
Read More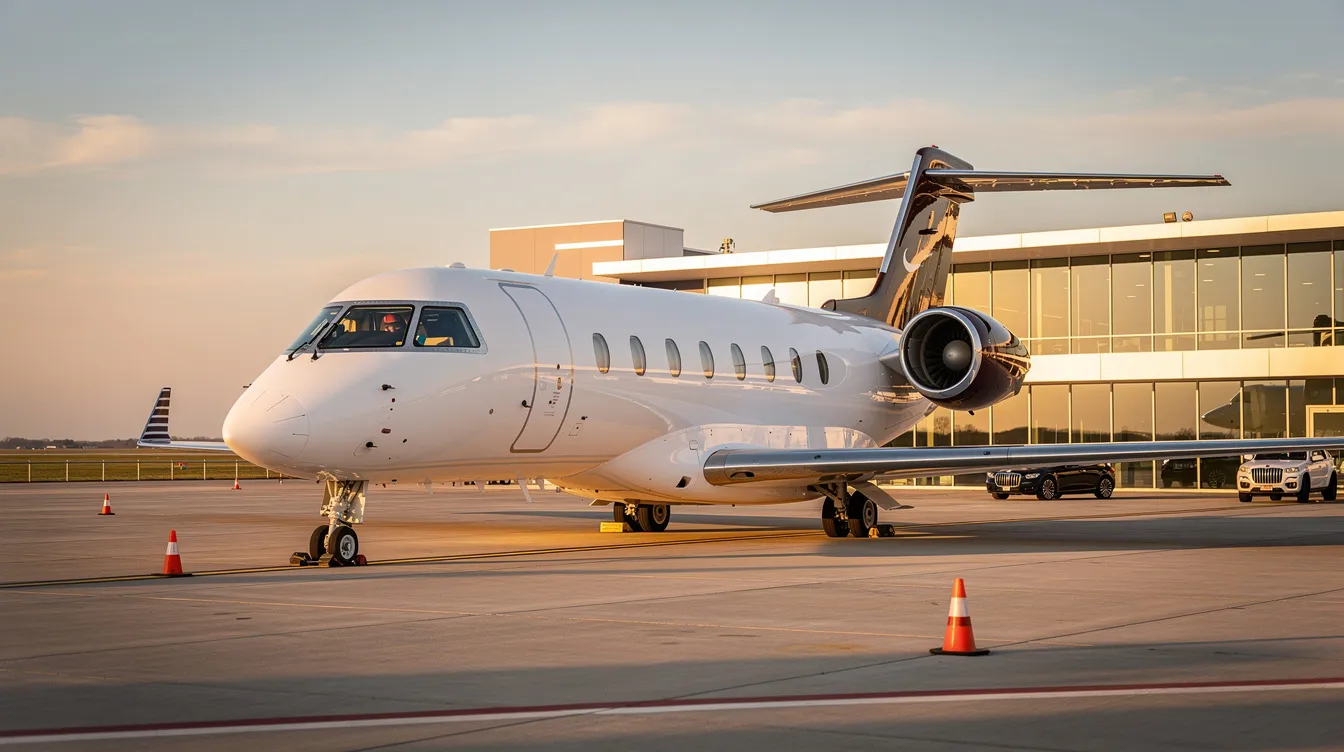
5
min read
NetJets App: How It Compares to Modern Digital Private Aviation Platforms
The NetJets app offers fractional owners and jet card holders seamless access to a vast private aviation fleet, allowing for easy flight requests and trip management. However, alternatives like Jettly provide a more flexible, app-first experience without long-term commitments, catering to occasional travelers seeking instant pricing and diverse aircraft options. This article compares the features of both platforms to help travelers choose the best fit for their needs.
Read MoreStay updated with our latest insights and tips to elevate your journey with us.
MEMBERSHIPS AND ASSOCIATIONS



© 2026 Jettly Inc. All rights reserved.
Disclaimer: Jettly operates as a charter broker, offering access to a global digital jet charter marketplace. Jettly is not a direct air carrier and does not own or operate aircraft. All advertised flights are conducted by third-party air carriers that are fully licensed and hold the appropriate Part 135 or Part 121 certifications issued by the Federal Aviation Administration (FAA) or equivalent regulatory authorities under U.S. or foreign law. Jettly complies fully with the U.S. Department of Transportation's Part 295 and Part 298 Charter Broker regulations. Jettly does not carry additional liability insurance. Passengers are covered by aircraft operator insurance. TICO: 50023770


